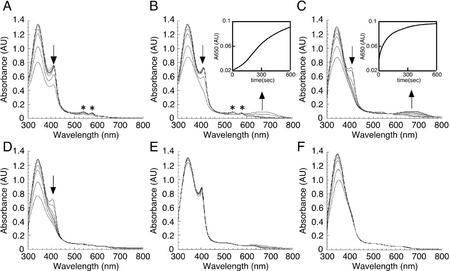
Figure 3.
Catalytic activity of AtHO1. Time-dependent absorbance changes were monitored during the AtHO1 reaction with spectra taken at 0, 5, 20, 60, 120, 300, and 600 s after the addition of NADPH. A, Control reaction including recombinant AtHO1 (10 μm), hemin (10 μm), and ferredoxin (50 μg mL−1). Inset, Change in A650 as a function of time. B, Reaction + desferrioxamine (2 mm). C, Reaction + ascorbate (5 mm), +desferrioxamine. Inset, Change in A650 as a function of time. D, Reaction + ascorbate, −ferredoxin. E, Reaction + ascorbate, +desferrioxamine, −ferredoxin. F, Reaction − AtHO1, +ascorbate, + desferrioxamine. Asterisks indicate α-/β-bands of the ferrous dioxyheme complex. Arrows indicate the direction of absorbance changes during incubation.

