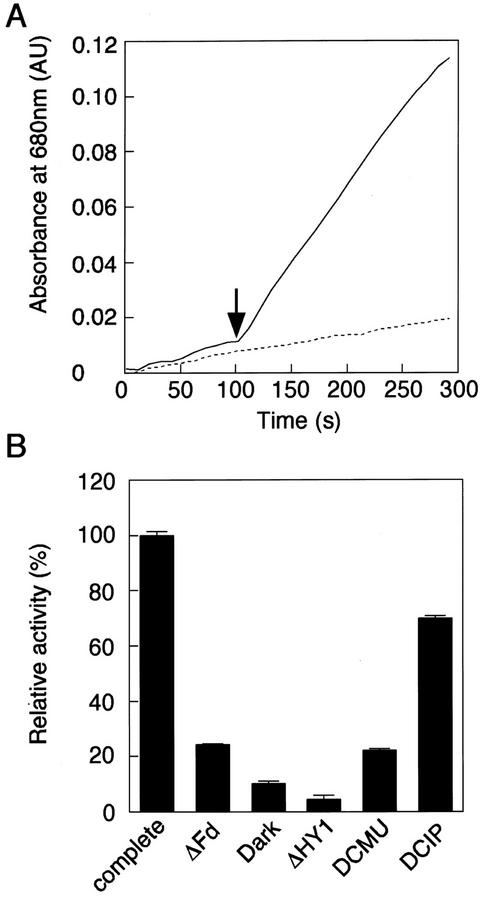
Figure 4.
Light dependency of the AtHO1 reaction. Light dependency of the AtHO1 reaction was observed using isolated thylakoid membranes as an electron donor. A, The reaction was incubated at 25°C in the dark (dashed line) or irradiated with white light after 100 s (solid line) as indicated by the arrow and absorbance was monitored at 680 nm (indicating BV synthesis). B, The relative AtHO1 activity determined as the rate of change of A680 was measured in the complete reaction in the light (complete) and in darkness (dark), in the absence of ferredoxin (ΔFd) or AtHO1 (ΔHY1), and in the presence of 10 μm dichlorophenyldimethylurea (DCMU) or 10 μm DCMU and 100 μm dichloroindophenol. Error bars indicate ± se.

