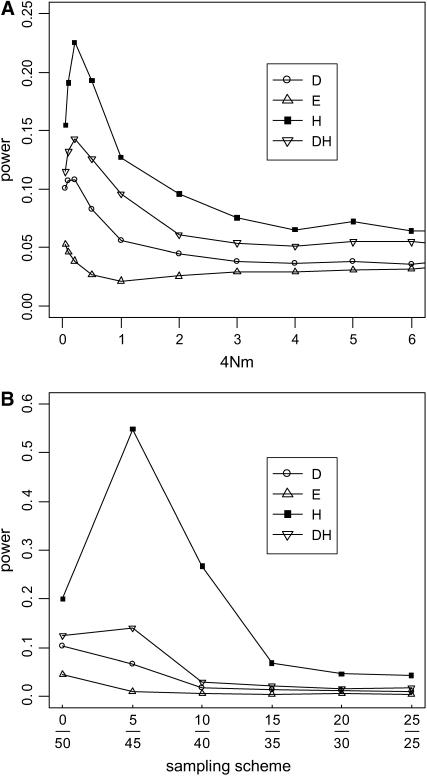
Figure 6.—
Sensitivity (or power) of the tests to population subdivision. A symmetric two-deme model with θ = 2 per deme (2N genes per deme) was simulated. Populations are assumed to be in drift–migration equilibrium with symmetric migration at a rate of m, which is the fraction of new migrants each generation. Sample size (n) is 50. (A) Sensitivity as a function of the degree of population subdivision, expressed as 4Nm on the x-axis. All genes were sampled from one subpopulation. (B) Sensitivity as a function of the sampling skewness; for example, 5/45 means 5 genes are sampled from one subpopulation and 45 from the other. In this case, 4Nm = 0.1, a value at which the tests show sensitivity to population subdivision in A.

