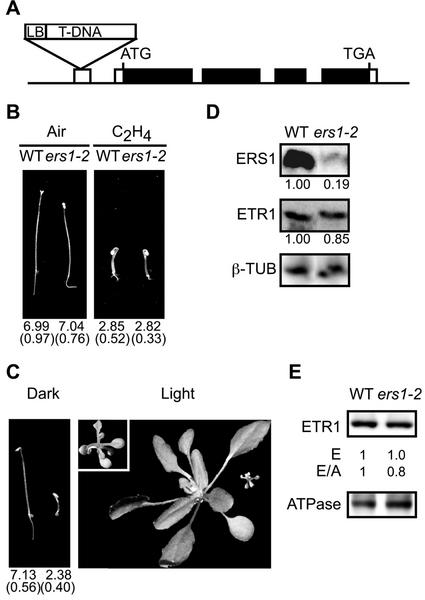
Figure 5.
Analysis of the T-DNA insertional mutant ers1-2. A, Location of T-DNA insertion in the ERS1 gene. Black bars and white bars represent translated and untranslated regions of the ERS1 transcript, respectively. B, Phenotype of 3.5-d-old dark-grown seedlings containing the ers1-2 mutation grown in air or ethylene (50 μL L−1). Mean hypocotyl lengths are given in millimeters with sd in parentheses. C, Phenotype of the ers1-2;etr1-7 double mutant as compared with seedlings with wild-type phenotype segregating from the same population. Seedlings were grown in dark for 3.5 d or in the light for 4 weeks. The ers1-2;etr1-7 double mutant is on the right in each panel, and a 2-fold enlargement is also inset to reveal details of the light-grown seedling. D, Northern-blot analysis of ERS1 and ETR1 expression in the ers1-2 mutant line performed using 25 μg of total RNA. The numbers represent the expression level of the ethylene receptor genes after normalization for the level of β-tubulin expression. E, Effect of the ers1-2 mutation upon expression of ETR1 in etiolated seedlings. Immunoblot analysis was performed using antibodies directed against ETR1 and the H+-ATPase as an internal control on 15 μg of membrane protein. Expression levels are given based directly upon that determined with anti-ETR1 antibody (E) and normalized against the ATPase levels (E/A).

