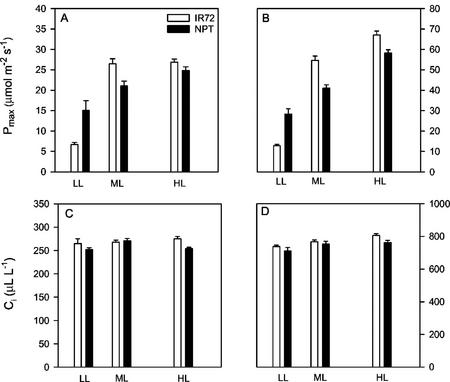
Figure 5.
Pmax (A and B) and intercellular [CO2] (Ci; C and D) for IR72 (white bars) and NPT (IR65600-42-5-2; black bars) grown under LL, ML, and HL (10%, 40%, and 100% of full sunlight, respectively). Pmax and Ci were measured at: ambient (350 μL L−1; A and C) and high (900 μL L−1; B and D) CO2 levels. Means ± se, n =20 to 30 (individual plants).

