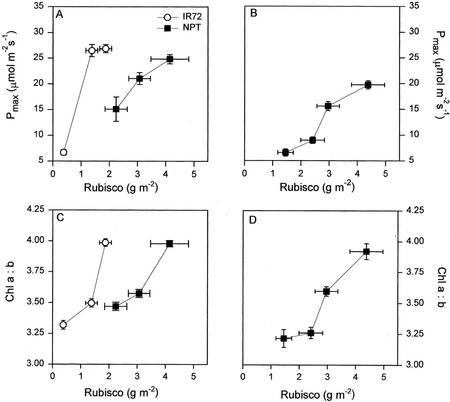
Figure 9.
The relationship between Pmax at ambient (350 μL L−1) CO2 levels and Rubisco content (A and B) and between Rubisco content and Chl a to b ratio (C and D) for NPT (▪) and IR72 (○); for LL, ML, and HL (A and C) as in Figures 5 and 6; and for leaves at different canopy positions (B and D) as in Figures 2 and 3.

