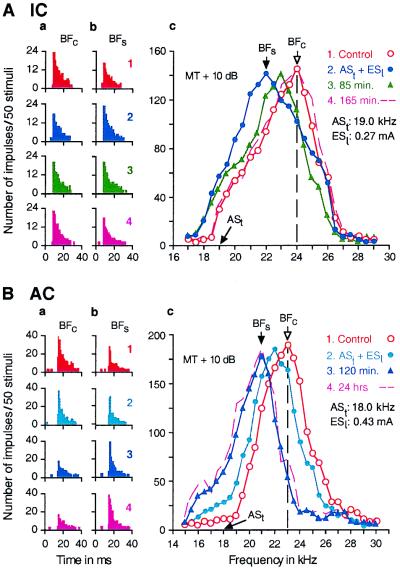
Figure 1.
Changes in the responses (a and b) and frequency-response curves (c) of a single collicular neuron (A) and a single cortical neuron (B) evoked by a 30-min-long conditioning session consisting of 60 stimulus pairs of a short ASt followed by an ESl. All of the data were obtained with tone bursts fixed at 10 dB above the minimum threshold (MT) of a given neuron. In A, ASt was 19.0 kHz, and the BF of the collicular neuron was 24.0 kHz. In B, ASt was 18.0 kHz, and the BF of the cortical neuron was 23.0 kHz. The data in A and B were obtained before (1, control condition), immediately after (2), 85 or 120 min after (3), and 165 min or 24 h after conditioning (4). The poststimulus time histograms in columns a and b, respectively, show the changes in the responses at the BFs in the control (BFc) and “shifted” conditions (BFs), which are indicated by arrows in c. The BF shift of the collicular neuron recovered (i.e., BFs shifted back to BFc) 165 min after the conditioning, but that of the cortical neuron did not recover even 24 h after the conditioning.

