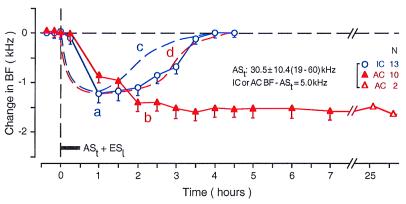
Figure 2.
Time courses of the BF shifts of collicular (curve a, open circles) and cortical neurons (curve b, filled triangles) evoked by a 30-min-long conditioning session consisting of ASt + ESl (horizontal bar). The time course is quite different between the collicular and cortical neurons. Each data point represents the mean and standard error of the values obtained from the number of neurons (N) listed on the right. The mean frequency of ASts ranged from 19 to 60 kHz (30.5 ± 10.4 kHz). The BFs of 13 collicular and 10 cortical neurons studied were 5.0 kHz higher than the frequency of ASt. For comparison, the time courses of the BF shifts of collicular and cortical neurons evoked by a focal electrical stimulation of the AC are also shown in the figure by the dashed curves c and d, respectively (based on refs. 6 and 7). These two dashed curves are similar to curve a.

