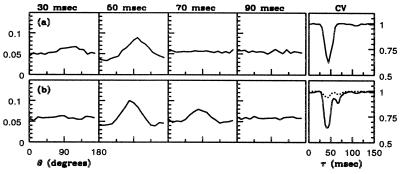
Figure 2.
P(θ, τ) from RTC at several times τ, showing the dynamics and sharpening of orientation selectivity. A time series for the stimulus is constructed by choosing a fixed-wavelength sinusoidal standing grating (parametrized by orientation and a spatial phase) randomly from a stimulus set. Stimuli are shown successively, each for 17 msec. The spike train of a visually responsive neuron is recorded and is correlated against the stimulus time series. The normalized correlation, P(θ, τ), is the probability that τ msec before a spike was produced, an image with angle θ was presented. The graph's left vertical scale is probability, whereas the vertical scale on the right, for the rightmost boxes only, is in units of circular variance. (a) Experiment (4Cα simple cell, 18 angles). (b) Model (16 angles). The rightmost boxes show circular variance CV[P(⋅, τ)] (see Eq. 4). The dashed CV[P] curve in b is that for an uncoupled model neuron, and it shows that feed-forward input by itself produces only a small reduction in CV in the RTC experiment.

