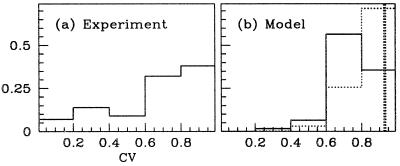
Figure 4.
Histogram (fraction of total population) of tuning curve CVs. (a) Experiment, 42 4Cα neurons (presumably excitatory). (b) Model, showing both excitatory (solid) and inhibitory (dotted) neurons. (Neurons with low peak firing rates are discarded.) Also shown is the CV of the feed-forward response (thick dashed vertical line).

