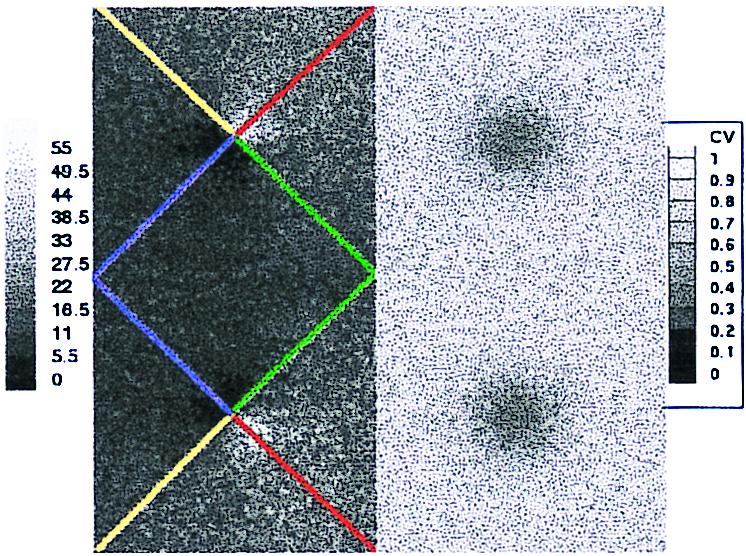
Figure 5.

Spatial distribution of response properties across the model's four hypercolumns. (The upper left quadrant is that hypercolumn depicted in Fig. 3.) The left two hypercolumns show the time-averaged firing rate of the excitatory population in response to a grating drifting at angle θ = 45° (averaged over 50 cycles). The lines emanating from pinwheel centers label orientation columns at 0° (green), 45° (red), 90° (yellow), and 135° (blue). The right two hypercolumns show the spatial distribution of circular variance, CV[mj]. The scale on the left is in spiltes per second, and on the right is the range [0, 1] of the CV.
