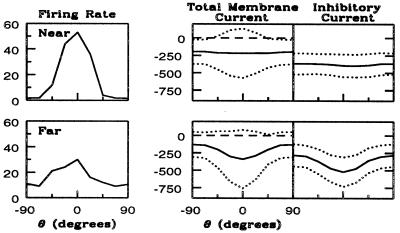
Figure 6.
Differences underlying selectivity for an excitatory neuron near (Upper) and another far (Lower) from a pinwheel center. (Left) Average firing rate as a function of θ. (Center) Time-averaged current at threshold (center curve), plus and minus 1.5 standard deviations (dotted curves), as a function of θ. (Right) Time-averaged inhibitory network contributions, plus and minus 1.5 standard deviations, to this current.

