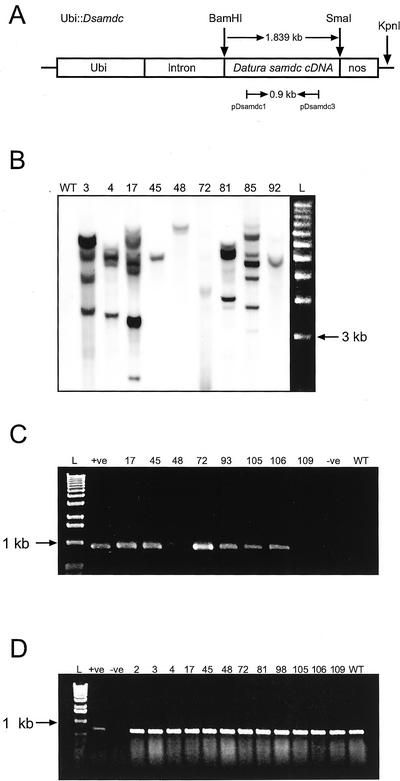
Figure 1.
Generation and molecular characterization of transgenic rice plants expressing the D. stramonium samdc cDNA. A, Map of Ubi::Dsamdc showing transcription unit, relevant restriction sites, and primers used for PCR and RT-PCR analyses. The D. stramonium samdc cDNA is 1.839 kb in size. KpnI has a single restriction site in the plasmid. Nos, Nopaline synthase. Arrows represent primers and length of amplified fragment. B, DNA gel-blot analysis of transgenic rice plants. Genomic DNA (10 μg) was digested with KpnI and probed with the 0.9-kb DIG-labeled PCR product from Ubi::Dsamdc. Exposure time was 10 min; wt, wild type; numbers represent putative transgenic plants; L, molecular size marker (1-kb DNA ladder, Invitrogen, Carlsbad, CA). C, RT-PCR analysis of D. stramonium samdc cDNA (0.9 kb) from total RNA extracted from controls and plants transformed with Ubi::Dsamdc. L, Molecular size marker (1-kb DNA ladder, Invitrogen); +ve, positive control, plasmid Ubi::Dsamdc; −ve, negative control (water); numbers indicate independent transgenic plants; wt, wild type. D, RT-PCR analysis of rice samdc from total RNA extracted from controls and plants transformed with Ubi::Dsamdc. L, Molecular size marker (1-kb DNA ladder, Invitrogen); +ve, positive control, plasmid Ubi::Dsamdc; −ve, negative control (water); numbers represent indicate independent transgenic plants; wt, wild type.

