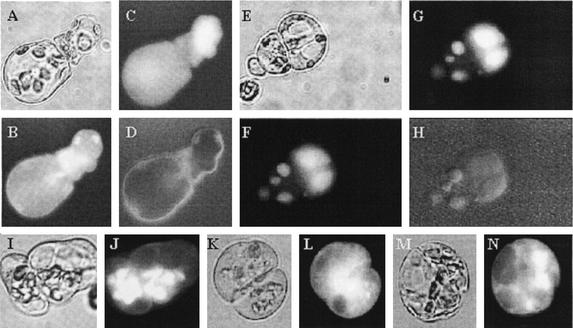
Figure 4.
Cellular distribution of fluorescent dyes used to measure intracellular pH. A through D, Example of FDA staining used for the determination of pHc. The cells shown were grown at 1 μm 2,4-D for 4 d (A, transmitted light; B, pH-dependent and -independent FDA fluorescence together at 490 nm; C, fluorescence dependent only on dye distribution at 440 nm; and D, pH-dependent fluorescence ratio image). The images were taken 5 min after FDA loading when the dye is predominantly in the cytoplasm. E through H, Example of BCECF staining of cells used to determine vacuolar pH. The cells shown were grown at 10 μm 2,4-D for 4 d (E, transmitted light; F, pH-dependent and -independent BCECF fluorescence together at 490 nm; G, fluorescence dependent only on dye distribution at 440 nm; and H, pH-dependent fluorescence ratio image). The images were taken 30 min after BCECF-AM loading. I through N, Differential FDA accumulation in the chloroplasts of protoplast-derived alfalfa cells under different culture conditions. Transmitted light (I, K, and M) and fluorescent (J, L, and N) microscopic images of cells grown at 1 μm 2,4-D (I and J), 10 μm 2,4-D (K and L), and 1 μm 2,4-D with 1 mm Fe (M and N), respectively. The images were taken 30 min after FDA loading when the dye accumulated in the chloroplasts in the elongated cells grown in the presence of 1 μm 2,4-D.

