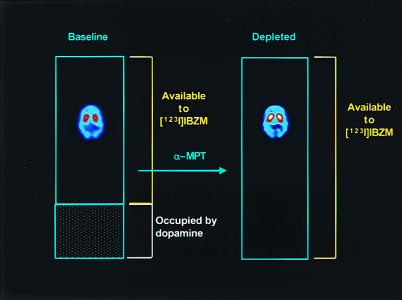
Figure 1.
Schematic presentation of the experiment. The blue rectangles represent the total population of D2 receptors. At baseline, an unknown proportion of these receptors is occupied by dopamine (shaded area), and only a fraction of receptors are unoccupied and available to [123I]IBZM binding. After α-MPT-induced depletion of endogenous dopamine, all receptors are available to [123I]IBZM binding. Thus, comparing the [123I]IBZM binding potential at baseline and after dopamine depletion allows derivation of the proportion of D2 receptors that were masked by dopamine at baseline. The SPECT images display distribution of [123I]IBZM in one subject at baseline and after dopamine depletion (note the increase in specific binding in the striatum).

