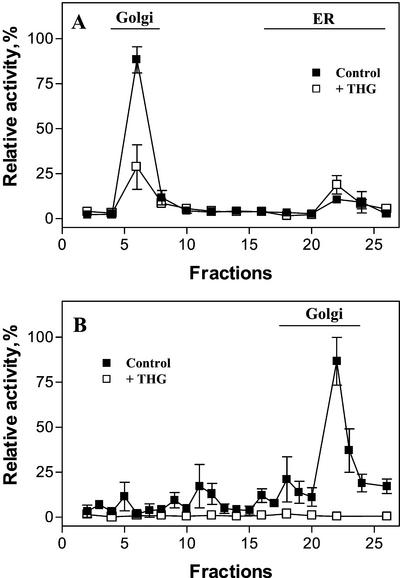
Figure 5.
Effect of thapsigargin on the Ca2+ uptake by subcellular fractions from etiolated pea stems. Organelles were separated as described in Figures 1A or 2B, and the uptake of 45Ca2+ by subcellular fractions was measured in a reaction mixture containing 1 μm free Ca2+ in the presence (□) and absence of 2 μm thapsigargin (▪). The lines named Golgi in A and B indicate the distribution in the gradient of the Golgi marker XG-FucTase. The line named ER in A indicates the distribution in the gradient of the ER marker, NADH Cyt c reductase activity insensitive to antimycin A. The activity of the ER marker was negligible in B. THG, Thapsigargin.

