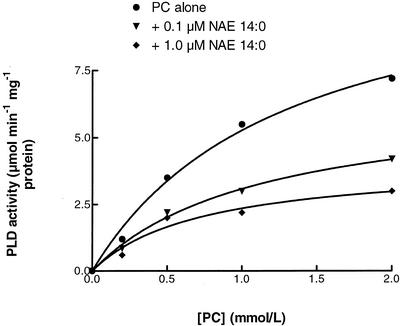
Figure 4.
Initial velocity measurements of cabbage PLD made at increasing substrate (PC) concentrations without (▾) or with 0.1 μm NAE 14:0 (♦), or with 1.0 μm NAE 14:0 (▵). Data points are averages of triplicate values with sd (less than 10%) omitted for clarity. Lines represent the data fit to the Michaelis-Menton equation with software (GraphPad Prism; GraphPad Software, San Diego). Kinetic parameters estimated by curve fitting were as follows: Apparent Vmax values of 11.96, 6.49, or 4.06 μm min−1 mg−1 protein were estimated with PC alone, with 0.1 μm NAE 14:0, or with 1.0 μm NAE 14:0, respectively, whereas Km values of 1.27, 1.10, or 0.72 μm were estimated with PC alone, with 0.1 μm NAE 14:0, or with 1.0 μm NAE 14:0, respectively. Absolute values of kinetic parameters varied in replicate experiments, but trends were identical; i.e. addition of NAE showed concentration-dependent reductions in apparent Vmax and Km for PLD toward its PC substrate.

