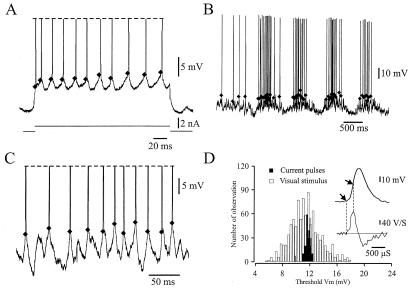
Figure 1.
Action potential threshold shows marked variation in response to visual stimulation but not depolarizing current pulses. The data are taken from a layer II/III regular spiking pyramidal neuron with a simple receptive field. (A) Response of the cell to a suprathreshold depolarizing current pulse (900 pA, 200 ms). In this and the other plots, spike threshold is indicated by the filled diamonds. (B) Response of the same cell to a drifting square-wave grating (0.6 cycles/degree) presented to the dominant eye. (C) An expanded view of the activity in B during the peak of one cycle of the visual response. (D) Histogram of spike thresholds in response to the depolarizing current pulses (filled bars; σ = 0.34 mV) and the visual stimulus (unfilled bars; σ = 2.5 mV). D Inset illustrates the method for calculating spike threshold. The upper trace shows a single action potential marked by arrows indicating the threshold voltage (Lower) and (dVm/dt)max (Upper). The lower trace shows dVm/dt for the same action potential. The horizontal line in the lower plot indicates a value of 0 for dVm/dt.

