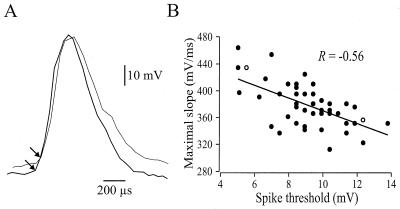
Figure 4.
Spike threshold is inversely correlated with the maximal rate of depolarization during the action potential upstroke. (A) Raw data depicting single spikes arising from a different threshold Vm (arrows). Note the difference of the rising slope in the two cells. (B) Scatter plot of the visually evoked spike threshold vs. the maximal rising slope taken from one trial. The straight line shows the linear regression fit to the data. The unfilled circles represent the data for the two spikes shown in A.

