Figure 5.
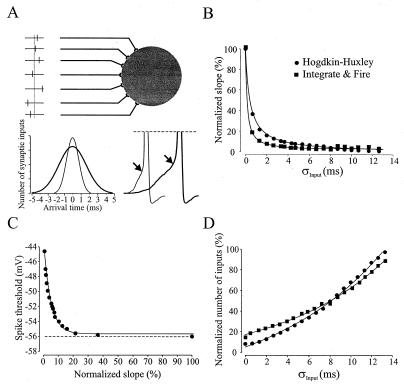
Spike threshold is inversely correlated with synaptic input synchronization in a model neuron. (A) Schematic diagram of the simulation protocol. Upper depicts the model neuron (Right) and its excitatory synaptic inputs (Left). Lower shows two examples of the distribution of synaptic arrival times (Left) and the corresponding action potentials in the model neuron. Spike threshold is marked by the arrows. (B) Plot of σinput vs. normalized Vm slope preceding a spike for HH (filled circles) and integrate-and-fire (filled squares) neurons. The data were fit by the equation y = 1/(a + bt), where t = σinput. (C) Plot of the normalized Vm slope (dVm/dt) preceding a spike vs. spike threshold. The data were fit by the equation y = a + be−τ/c, where τ = dVm/dt. The dashed line indicates the firing threshold of the integrate-and-fire neuron. (D) Plot of σinput vs. the normalized number of inputs needed to elicit a spike on 95% of the simulated trials for both types of cells. The data were fit by the equation y = a + becτ, where τ = σinput.

