Figure 2.
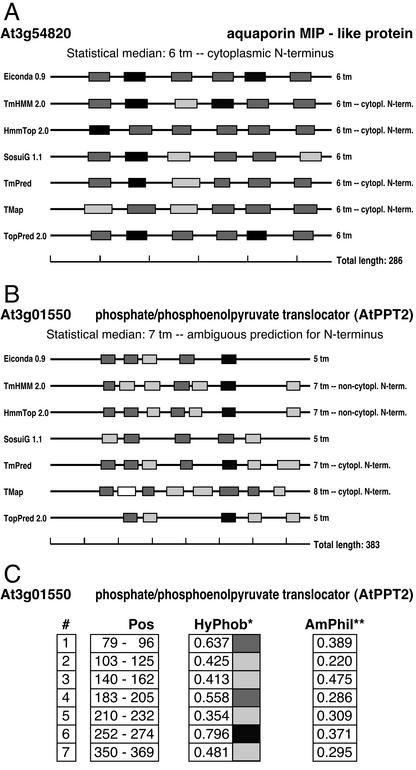
Graphical representation of TM span predictions. ARAMEMNON displays plots of the TM predictions by seven programs. A, TM span predictions for an aquaporin MIP-like protein (At3g54820). All seven programs uniformly predict six TM spans at almost the same positions, and TmHMM 2.0, HmmTop 2.0, TmPred and TMap predict the same orientation within the membrane. The shading intensity of the membrane span candidate segments indicates the mean hydrophobicity range according to a normalized hydrophobicity scale (Eisenberg et al., 1984): white, 0 to 0.24; light gray, 0.25 to 0.49; dark gray, 0.50 to 0.74; and black, 0.75 to 0.99. B, TM span predictions for the PPT2 protein (At3g01550). The predictions differ in the number of TM spans, location of TM spans, and orientation of the protein within the membrane. C, For each prediction, the details are shown. #, Predicted TM spans starting from the N terminus; Pos, location of the TM span in the protein; HyPhob, mean hydrophobicity within the membrane span candidate segment (Eisenberg et al., 1984). The shading intensity correlates to that in A; AmPhil, relative maximal amphiphilicity within the membrane candidate segment.

