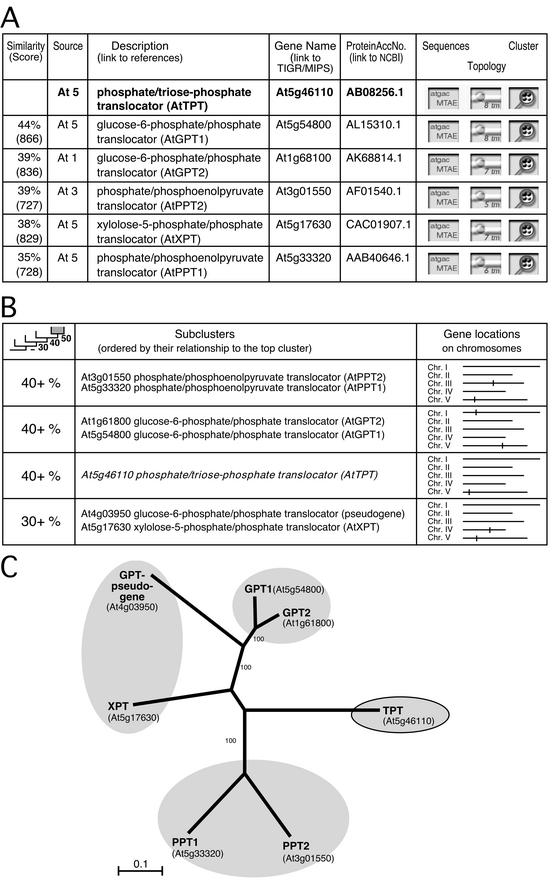
Figure 3.
TPT-related PTs identified by ARAMEMNON DB. A, List-form display of TPT-related proteins. The columns show (from left to right): amino acid similarity excluding gaps and Smith-Waterman score; organism (At, Arabidopsis) and chromosome number; gene annotation (with links to relevant publications); gene name (with links to TIGR and Munich Information Center for Protein Sequences DBs); protein accession number in GenBank (with link to National Center for Biotechnology Information [NCBI]); button to call protein, cDNA, genomic DNA, 5′- and 3′-untranslated region sequence display; button to call the TM and signal sequence prediction display; button to call the family structure (cluster) display, as shown in B. B, Columns from left to right: average subcluster amino acid similarity levels; members of the subclusters; chromosomal location of genes. C, NJ tree based on a multiple alignment of PT sequences performed by ClustalX. The numbers beside branches indicate the frequency (%) with which the branch was found in 1,000 bootstrap replicas. The shaded branches correspond to the subclusters generated by ARAMEMNON DB.

