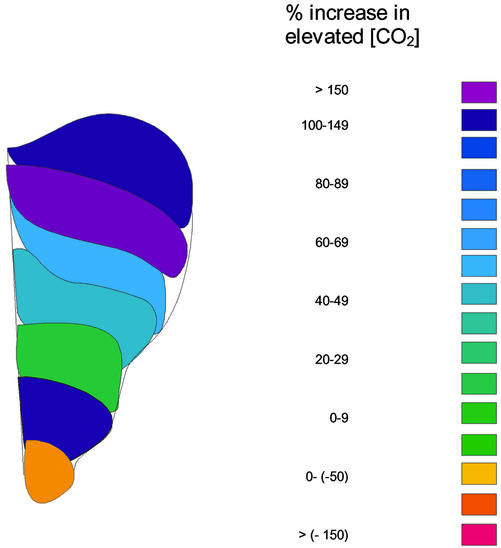
Figure 3.
Schematic representation of the effect of elevated [CO2] (550 μmol mol−1) on the absolute spatial expansion rates (mm2 d−1), calculated as (elevated − ambient)/ambient × 100, for P. × euramericana leaves, after exposure to either ambient or elevated [CO2] (550 μmol mol−1). Data represent the mean spatial values for nine leaves.

