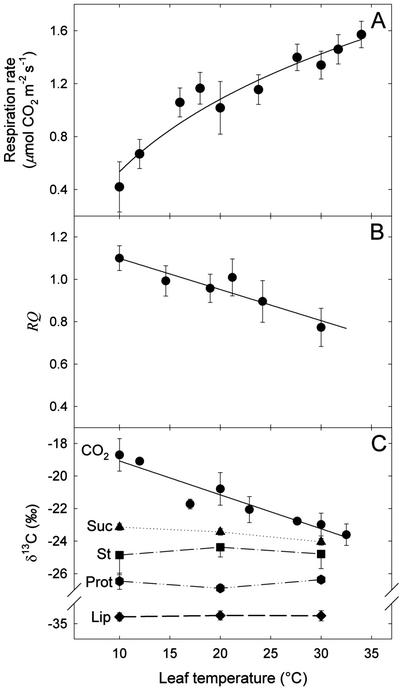
Figure 1.
Effect of temperature on leaf respiration in French bean. Respiration rate (A), RQ (B), and δ13C of CO2 (circles), Suc (triangles), starch (St, squares), heat-precipitated proteins (Prot, hexagons), and lipids (Lip, diamonds; C) of intact leaves are plotted as a function of temperature. CO2 was collected in a closed system for respiration measurements and isotope analyses. Data are means of three independent replicates ± ses. Linear regressions for the RQ and δ13C value of respired CO2 give y = −1.47 10−2 x + 1.24 (r2 = 0.87) and y = −0.21x −16.98 (r2 = 0.91), respectively. Regressions are significant for both RQ and δ13C (F = 26.30, P < 0.0068, and F = 61.16, P < 0.0002, respectively).

