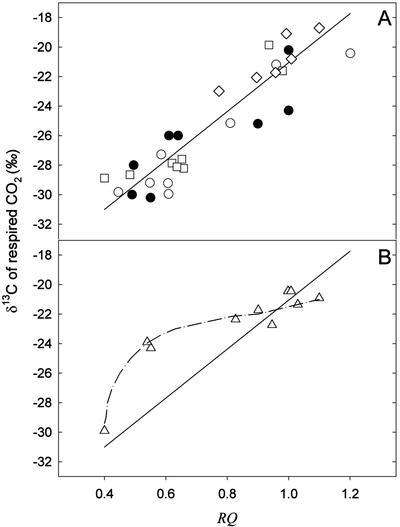
Figure 4.
Relationship between δ13C of dark-respired CO2 and the RQ. A, Data are taken from Figures 1 (diamonds) and 3 (white circles, 20°C; and squares, 30°C) and from the literature (James, 1953; Park and Epstein, 1961; Smith, 1971; black circles). The linear regression does not take into account data from the literature. The regression equation is: y = 16.57x − 37.62 (r2 = 0.87). The regression is significant (F = 144.21, P < 0.0001). B, Data taken from the “continuous darkness” experiment at 10°C of Figure 3 (triangles). The solid line represents the regression line obtained in A.

