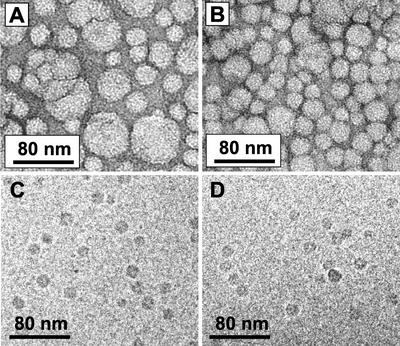
Figure 3.
Electron microscopic (EM) analysis of liposomes. A, EM image of PA-derived liposomes before separation by gel filtration, negatively stained with uranyl acetate, ×47,000. B, EM image of PA-derived SUV after gel filtration, negatively stained with uranyl acetate, ×47,000. C, Cryo-image of PA-derived SUV before incubation with DHN1, ×47,000. D, Cryo-image of PA-derived SUV after incubation with DHN1, ×47,000.

