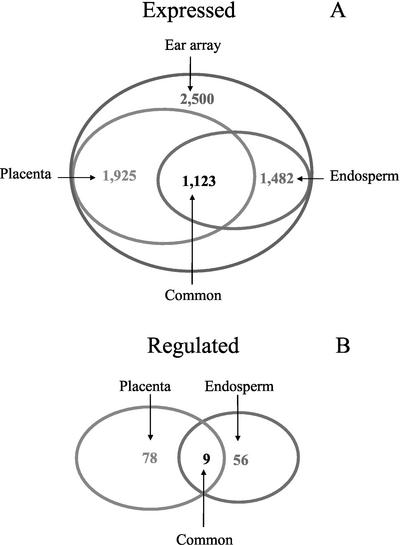
Figure 1.
Shared expression of cDNAs between endosperm and placenta tissues at 9 DAP. A, The number of transcripts whose average fluorescence exceeded the negative-control threshold (Expressed) in each tissue. B, The number of transcripts that were differentially expressed (Regulated) in control versus water stress for each tissue. Fluorescence data from four replicate microarray slides for each tissue were used to calculate averages. Regulated genes were defined as those whose expression in controls was significantly different from water stress according to SAM analysis and had a minimum change of 1.6-fold.

