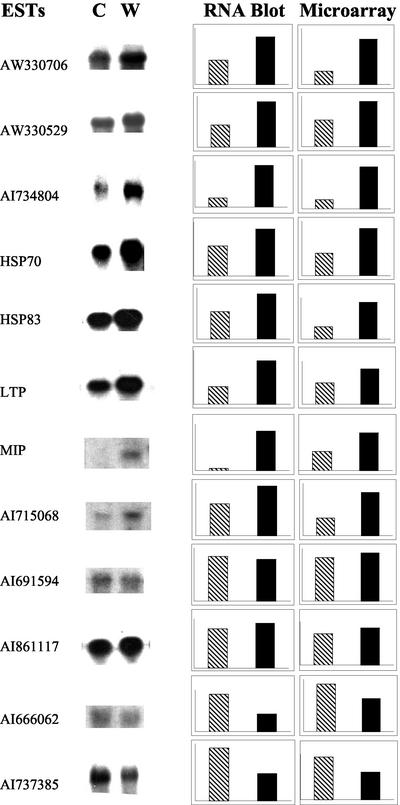
Figure 3.
Comparison of transcripts quantified by conventional RNA gel-blot versus cDNA microarray methods. Selected cDNA ESTs that microarray analysis indicated were up-regulated, down-regulated, or unchanged by water stress were used as probes in gel blots with 5 μg of total RNA from placenta tissue. The gene names or GenBank accession numbers of ESTs are presented with images of control (C) and water stress (W) 32P signal. Plots indicate the digitized signals (arbitrary scale) obtained for control (gray) and water stress (black) samples using RNA gel-blot and microarray methods.

