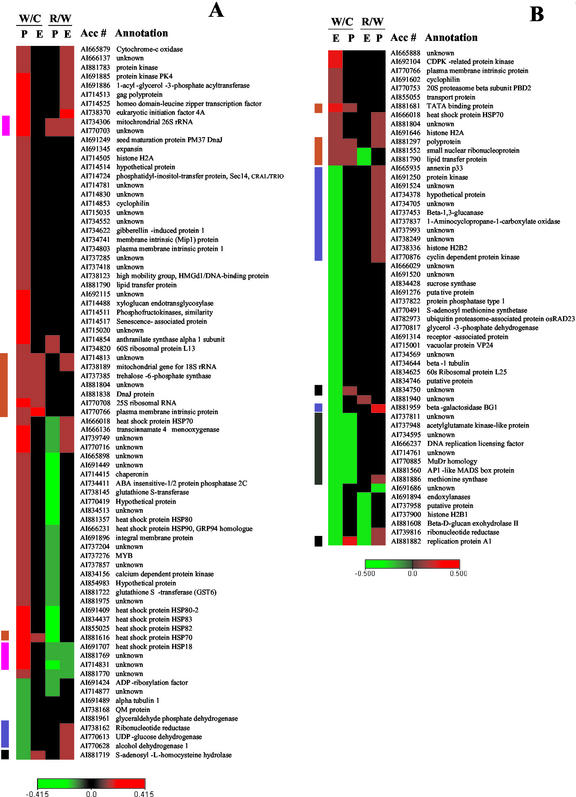
Figure 4.
Cluster analysis of genes found significantly affected by stress or rewatering in placenta (A) and endosperm (B). Genes were clustered using hierarchical clustering, and expression ratios in columns are shown for: placenta WS/C (1), endosperm WS/C (2), placenta R/WS (3), and endosperm R/WS (4), where WS is tissue sampled from water-stressed plants at 9 DAP, C is tissue sampled from control plants at 9 DAP, and R is tissue sampled from rewatered plants at 12 DAP. Ratios greater than 1:1 are indicated in red, ratios less than 1:1 are green, and ratios equal to 1:1 are black. A gene was included in A or B of this figure if its SAM score indicated expression significantly affected by one or more treatment in placenta or endosperm, respectively. Color bands to the left of each panel group together various response patterns.

