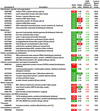
Table I.
Genes differentially expressed in placenta tissue in response to whole-plant water deficit
 |
The expression of mRNA extracted from placenta was determined by cDNA microarray hybridization. Relative fluorescence signals are shown for those genes whose 9-DAP comparison was statistically significant according to SAM procedures. Shown are the average fluorescence ratios of four replicate microarray slides for comparisons of water stress with control placentas sampled at 9 DAP (WS/C), and for comparisons of placentas sampled 3 d after rewatering (12 DAP; Recovery from stress) with placentas sampled at 9 DAP from water stressed plants (R/WS). The SAM relative difference statistic, di, is shown for the WS/C comparison. Values of WS/C are highlighted in red or green if expression was significantly up- or down-regulated, respectively. Values of R/WS are highlighted in red or green if expression differs by ≥ 1.4-fold, indicating up- or down-regulation, respectively. The control fluorescence signal is shown for 9-DAP placentas.
