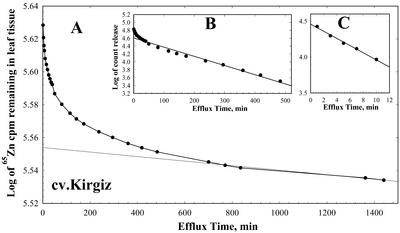
Figure 1.
A representative semilogarithmic plot of the amount of 65Zn remaining in leaf tissue versus time of efflux. The linear component in A, which represents vacuolar Zn efflux, was subtracted from the data points in A to obtain the points shown in B, which represent cytoplasmic Zn efflux. A similar procedure was used to derive the points in C, which represent cell wall Zn efflux, from the curve in B. Lines represent regression of the linear portion of each curve and were extrapolated to the y axis. Data points in A represent means ± se of four replicates.

