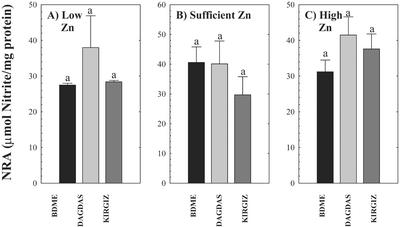
Figure 6.
NR activity in three wheat genotypes (cv BDME, cv Dagdas, and cv Kirgiz) grown under three Zn regimes: A, low Zn (0.1 pm); B, sufficient Zn (150 pm); and C, high Zn (1 μm) for 13 d. Each value represents the mean of four independent measurements. Error bars indicate se values. Means followed by different letters are significantly different at P ≤ 0.05 (Student's t test). The presence of the same letter indicates the absence of significant differences among genotypes.

