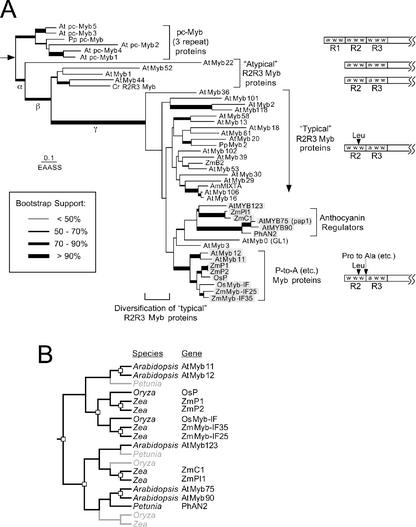
Figure 1.
Evolutionary relationships among plant MYB domain proteins. A, An estimate of phylogeny obtained using weighted neighbor joining of ML distance estimates obtained using the WAG+ Γ model of sequence evolution (parameters are provided in “Materials and Methods”). Sequences are from Arabidopsis (At), Chlamydomonas reinhardtii (Cr), rice (Oryza sativa; Os), P. patens (Pp), and maize (Zm). An arrow indicates the position of the root discussed in the text. The support for each of the branches is indicated by the thickness of the lines. Estimates of phylogeny obtained using both alignments were identical, with the exception of the C. reinhardtii R2R3 MYB, which shifted to a position outside of a clade containing AtMyb1, AtMyb44, and AtMyb55 in analyses of the large alignment. Branch lengths are proportional to the expected number of amino acid substitutions per site under the WAG+ Γ model. The specific molecular changes that occurred during the evolution each of the major phylogenetic groups are indicted by the structures of the MYB domains on the right of the tree. Sequences included in the figure were selected to sample the diversity of Mybs based upon C-terminal motifs. B, Pattern of gene duplications for sequence duplication/divergence of the groups of R2R3 Myb genes discussed in this study. The pattern of gene duplications is shown as a reconciled tree, showing genes that have been inferred but not identified in specific lineages in light gray text. These genes have either been lost during evolution or have not been sampled in the relevant lineages.

