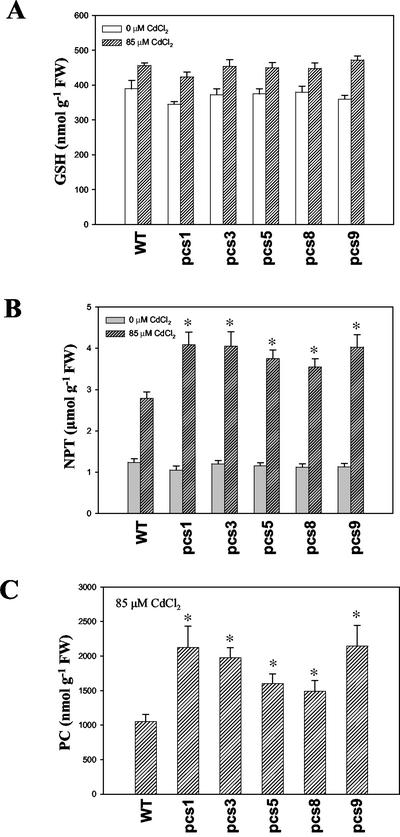
Figure 2.
Effects of AtPCS1 overexpression on GSH, NPT, and PC contents with or without Cd treatment. Plants grown on Murashige and Skoog agar medium for 10 d were transferred to a fresh medium containing 0 or 85 μm CdCl2, and were incubated for another 3 d. Whole seedlings of transgenic pcs lines and wild-type (WT) were used for analysis of total GSH (A), NPT (B), and PC (C). Values correspond to means ± se of four samples. An asterisk indicates significantly different (P < 0.05) from WT of the same treatment.

