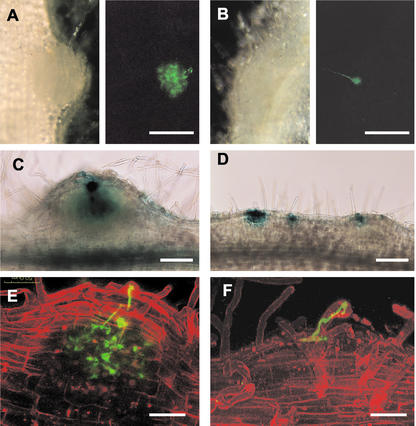
Figure 5.
Visualization of infection events in wild type and mutants after inoculation with M. loti carrying the GFP (A, B, E, and F) or lacZ gene (C and D). A and B, Light panels (left) represent micrographs of developing nodules by light microscopy, and adjacent dark panels (right) represent the same developing nodules viewed by fluorescence microscopy. A, Infection thread network in the wild-type nodule primordium; B, arrested infection in crinkle showing swelled infection thread at the base; C, successful infection in the wild type as indicated by the presence of blue stains in the inner tissue; D, arrested infections in crinkle at the superficial layer of the bumps. E and F, Confocal micrographs of root hairs with infection threads. Green represents GFP fluorescence, and red represents the fluorescence of the propidium iodide counterstain. E, Infection thread network in the wild type; F, arrested infection in crinkle at the epidermis. A and B, Two weeks after infection; C and D, 8 d after infection; E, 10 d after infection; and F, 15 d after infection. Bars in A and B = 250 μm; in C and D = 150 μm; and in E and F = 50 μm.

