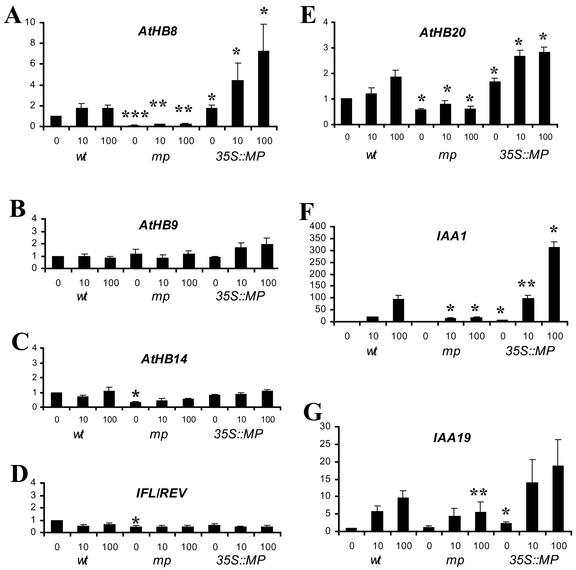
Figure 7.
Expression of HD-ZIP genes and AUX/IAA genes. Transcript abundance of the HD-ZIP genes AtHB8 (A), AtHB9 (B), AtHB14 (C), IFL1/REV (D), and AtHB20 (E) and of the AUX/IAA genes IAA1 (F) and IAA19 (G) were determined by northern-blot hybridization to total RNA from wild type (wt), mp mutant, and 35S::MP plants exposed for 30 min to 0, 10, and 100 μm IAA (indicated on x axes, genotypes below). Transcript levels (y axes) for each gene were calculated as multiples of the wild-type level at 0 μm IAA. Columns represent the mean ± se from 3 to 5 (A–D), and the results of two experiments (F and G). Significance of genotype-dependent differences between mp and 35S::MP values relative to wt type values under identical conditions as determined by Student's t test analysis is indicated by asterisks (*, 0.01 ≤ P < 0.05; **, 0.001 ≤ P < 0.01; ***, P < 0.001). Note that the absolute induction levels of IAA1 and IAA19 appear extremely high because of extremely low expression at 0 μm IAA.

