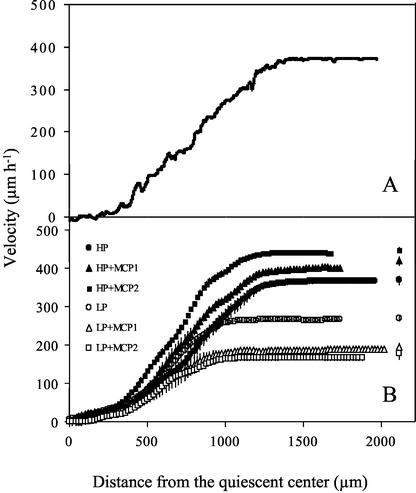
Figure 3.
Profiles of velocity versus distance from the quiescent center for the primary root of 9-d-old Arabidopsis plants. Treatments as for Figure 1. A, An example of a raw velocity profile for a single root (high-phosphorus treatment). B, Average velocity profiles. Raw velocity profiles for each root were smoothed and interpolated as described in “Materials and Methods.” Data points are means from six roots ± se, shown when larger than symbols. For clarity, data points are shown every 20 μm, but actual data were collected every 1 μm. Symbols near the right y axis represent average final velocity at d 9, taken from Figure 1, which were measured on roots of a different set of plants than those used for imaging and kinematic analysis.

