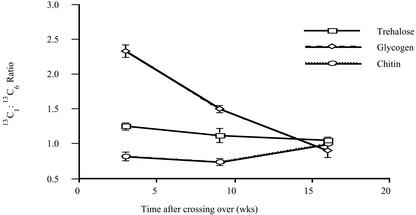
Figure 2.
The relative labeling in the C1 and C6 positions of carbohydrates from the ERM as a function of time after providing 13C1 Glc to the mycorrhizal roots. Data are derived from the intensities of C1 and C6 signals in spectra such as those shown in Figure 1. Error bars for are ± sem for at least three replicates per experiment.

