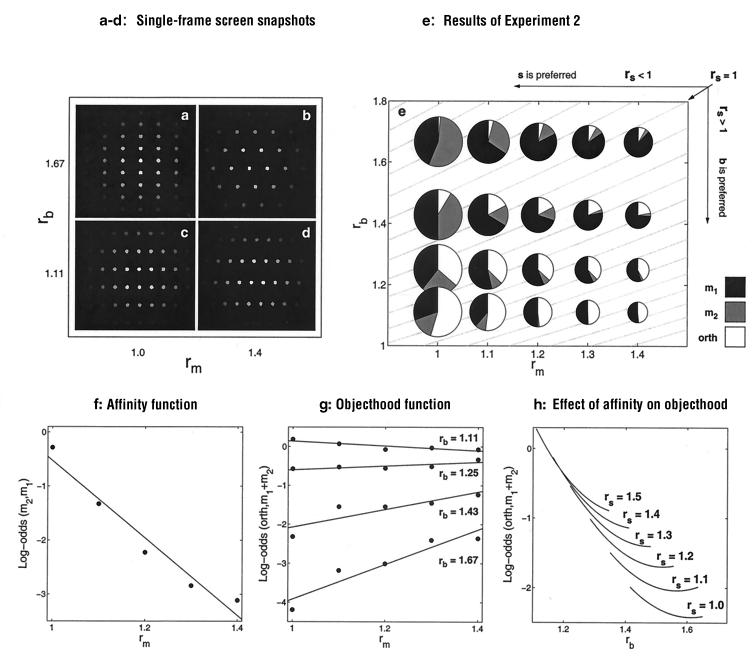
Figure 4.
(a–d) Single frames captured from the computer screen with the extreme values of rm = (|m2|/|m1|) and rb = (|b|)/|m1|). The snapshots are arranged in the (rm, rb) space, parallel to the plot in e. (e) The pie charts show the distribution of the three responses in the 20 motion lattices. The gray lines on the background are the iso-rs lines, where rs = (|s|/|b|), which are the contours for which within-frame spatial grouping should remain constant. For the isoline rs = 1.0, the organizations along s and b are equiprobable. It is marked with an oblique arrow (Upper Right). Conditions that favor dot grouping within the baselines (rs > 1.0; e.g., c and d) lie to the right of the isoline of rs = 1.0; in the rest of the conditions (rs < 1.0), dots tend to form groupings not along the baselines (as in a). (f) Affinity function collapsed across the rb conditions. (g) Four objecthood functions summarize the effects of the baseline and motion ratios, rb and rm. The frequency of g-motion grows rapidly as rb drops and groupings along the baselines become more prominent. This effect is evident both when rb is low (high ambiguity of e-motion) and when rb is high (m1 wins the competition with m2). The plot in h explicates the effect of rs. Dot organizations within the baselines dissolve as rs grows, which reduces the frequency of g-motion. In contrast to the prediction of the sequential model, e-motion and g-motion tradeoff within the iso-rs sets.

