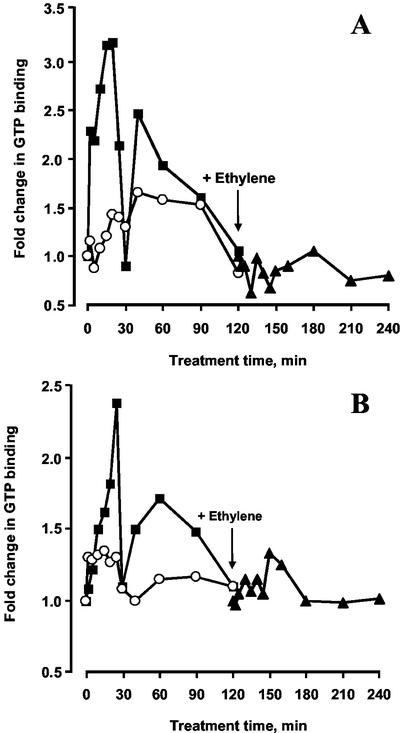
Figure 1.
Time course of GTP binding to monomeric G-proteins extracted with 750 mm KCl (A) and 1% (w/v) Triton X-100 (B) as affected by ethylene (1 μL L−1, ●), MCP (100 nL L−1, ○) and when ethylene was applied after pretreatment with MCP (▾). The arrow indicates time point of ethylene application. Experimental points are derived from scans of one-dimensional autoradiographs of SDS-PAGE separations of labeled proteins.

