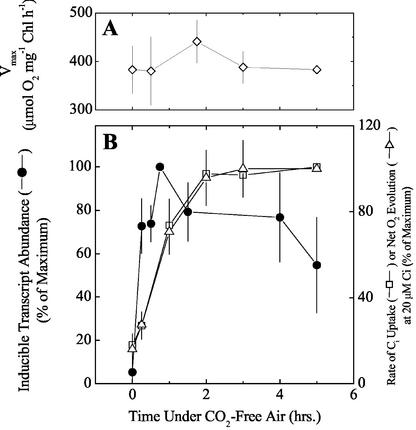
Figure 5.
Physiological responses of cells of Synechocystis PCC6803 to aeration for up to 6 h with CO2-free air. A, Vmax of net O2 evolution. The mean ± sd of three separate experiments are shown. B, Pooled average increase in ndhF3, sbtA, and cmpA transcripts replotted from the RT-PCR experiment shown in Figure 4 (black circles) and the rates of Ci uptake (white squares) or net O2 evolution (white triangles) supported by 20 μm Ci in the assay medium replotted from the drawdown experiments shown in Figure 2B.

