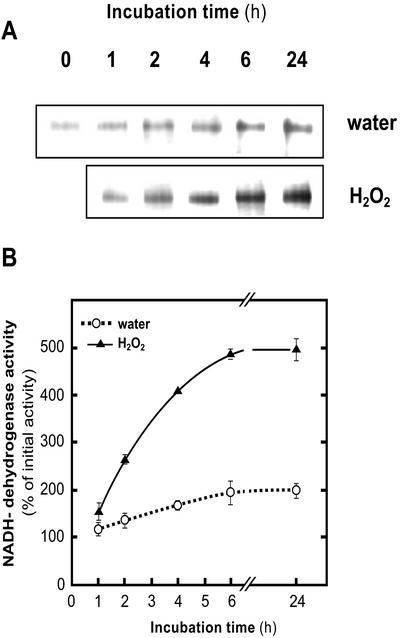
Figure 1.
Time course of H2O2 effects under PhL on Ndh activity. A, Typical NADH-DH zymograms of the Ndh complex of crude extracts (60 μg of protein per lane) from 14-d-old barley leaf segments incubated up to 24 h under PhL (300 μmol photon m−2 s−1) and water or H2O2 (10 mm). B, Quantification of Ndh complex activity by image analysis of NADH-DH zymograms as shown in A. Activities were expressed as percentages of the value in freshly detached leaves (0 time). Each value represents the mean ± se of at least four independent experiments.

