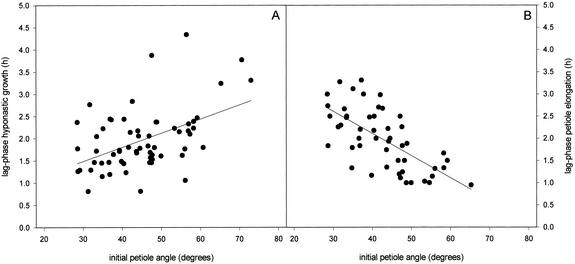
Figure 4.
Regression plots for the lag phase of (A) hyponastic growth (P < 0.001) and petiole elongation (B; P < 0.001), against the initial angle of the petiole. Lag phases were determined for all individual replicates of the data presented in Figure 2 and 3. r2 values were 0.229 for A and 0.439 for B.

