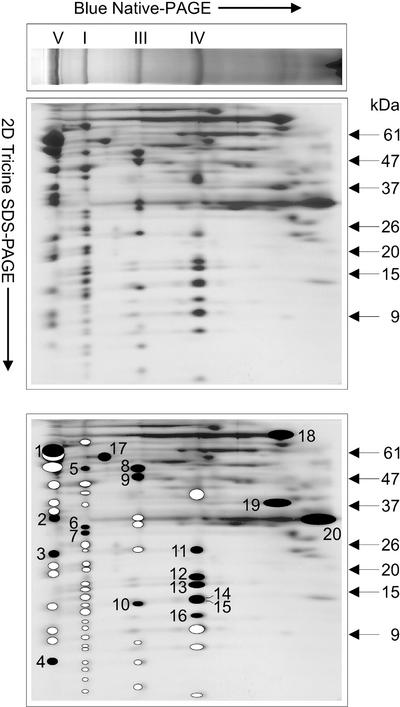
Figure 2.
Two-dimensional resolution of the mitochondrial protein complexes from C. reinhardtii. The main OXPHOS complexes are indicated on the first dimension BN-PAGE. A BN gel lane was cut out and placed horizontally for subsequent resolution of the protein complexes into their respective components on 2D-Tricine-SDS-PAGE. In the schematic representation of the subunits (bottom), the numbered black spots depict those polypeptides that were subjected to Edman degradation. The corresponding sequences are shown in Table III. White spots represent the other putative subunits of each complex.

