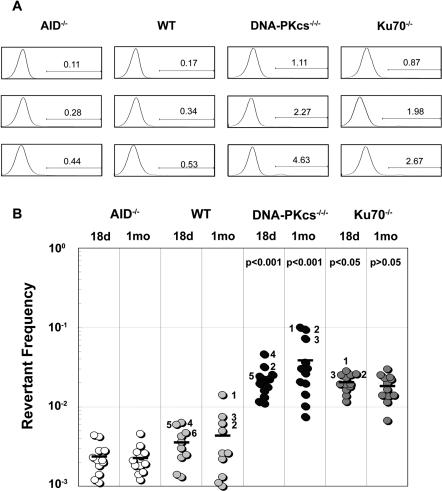
Figure 2.
IgM Reversion of sIgM− NHEJ deficient DT40 cells. (A) Representative histograms of IgM surface expression on subclones expanded for 18 days in culture. AID−/−, WT, DNA–PKcs−/−/− and Ku70−/− DT40 cell lines containing a frameshift in the Vλ-region were subcloned and expanded in culture. Cultures were stained with FITC-conjugated anti-chicken IgM and analyzed by flow cytometry. Gating for positive revertants was set at 8-times above the negative peak. Numbers indicate the percentage of IgM positive cells in each histogram. Three histograms are shown for each cell line that represent cultures that were low, medium and high for IgM+ cells. (B) Fluctuation analysis of IgM reversion for AID−/−, WT, DNA–PKcs−/−/− and Ku70−/− DT40 cell lines. Multiple subclones from each cell line were expanded and analyzed for IgM expression at 18 and 30 days. Average reversion frequency is denoted by a horizontal bar. Statistics are shown (see Materials and Methods) comparing the NHEJ-deficient cells to WT DT40 cells for the respective time points. Numbers beside symbols indicate clone number and correlate to sequence data shown in Figure 3, Table 1, and Supplementary Figures 1 and 2.

