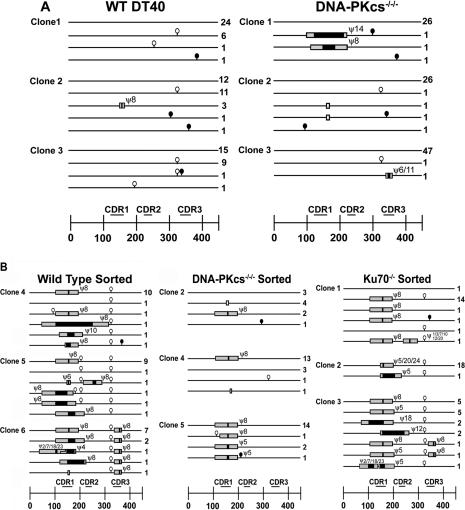
Figure 3.
Summary of gene conversion sequence data. (A) Vλ regions from WT and DNA–PKcs−/−/− DT40 subclones that were maintained in cell culture for 1 month. The DT40 clones analyzed for sequencing correspond to those shown in Figure 2B. Each line represents identical sequences of the Vλ region. Numbers to the right of each line indicates the number of times that sequence was observed. Symbols on and above the line indicate deviations from the founder sequence. Black circles: point mutations; white circles: ambiguous mutations; white bars: deletions; black bars: minimum GC tracts, grey bars: maximum GC tracts. Numbers above each tract indicate pseudogene donor, slashes between numbers indicate multiple possible donors. At the bottom is the scale in nucleotides, with the CDRs shown as labeled bars above the scale. 0 = the first nucleotide of the second exon. (B) Same as A, except sequences were obtained from IgM+ sorted WT, DNA–PKcs−/−/− and Ku70−/− cells.

