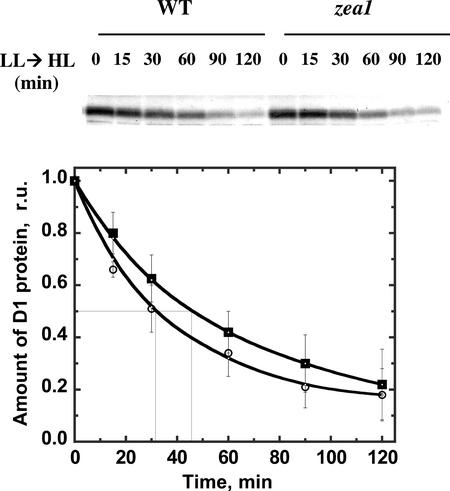
Figure 5.
Time course for the loss of the D1 protein from its 32-kD position after an LL → high light (HL) shift of the cultures. D. salina WT (white circles) and zea1 mutant (squares) were grown under LL to the late log phase. Cells were suspended in the presence of lincomycin immediately before an LL → HL shift. Western blots probed with polyclonal antibodies against the D1 protein are show in the upper panel. Densitometric quantification of the corresponding western blots for WT (white circles) and zea1 mutant (squares) are shown in the lower panel. The half time of the 32-kD protein loss was 32 ± 12 min for the WT and 45 ± 15 min for the zea1 mutant.

