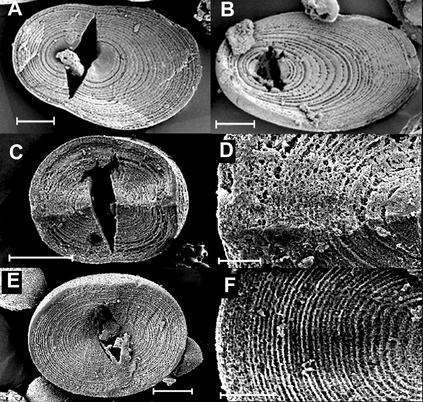
Figure 3.
Growth rings in granules from tubers of transgenic plants with altered carbohydrate supply or altered activities of starch-synthesizing enzymes. Scale bars on A, B, and E represent 5 μm, the scale bar on C represents 10 μm, and the scale bars on D and F represent 2 μm. A, Plant with reduced cytosolic FBPase activity (line F-70), grown in 16 h of light and 8 h of dark. B, Plant with reduced SPS activity (line 1–74), grown in 16 h of light and 8 h of dark. C and D, Plant with reduced activity of SSIII. E and F, Plant with reduced activity of GBSS and SSIII.

