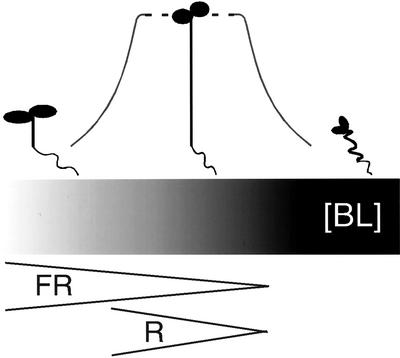
Figure 3.
Light quality and quantity regulate BR response. The range of seedling morphology observed in this study is depicted above a gradient representing predicted endogenous BR levels underlying this response. The gray curve connecting the seedlings reflects the noncontinuous nature of the BR response: areas of hyper-responsiveness flanking a zone where increased BR levels produce little effect. This reflects the finding that most light environments used in this study produced seedlings with little response to exogenous BL. Only seedlings grown in the extremes of light intensity showed robust BR responses. Wedges below the bar represent one model for spectrum-specific effects on BR response. The width of the wedge represents light intensity. In this model, less far-red (FR) than red (R) light is needed to reduce BR levels by a comparable amount. Thus, in addition to having shorter hypocotyls, seedlings grown in high-intensity far-red light would be more sensitive to exogenous BRs than seedlings grown in high-intensity red light. Dark is the point at the far right of both brackets.

