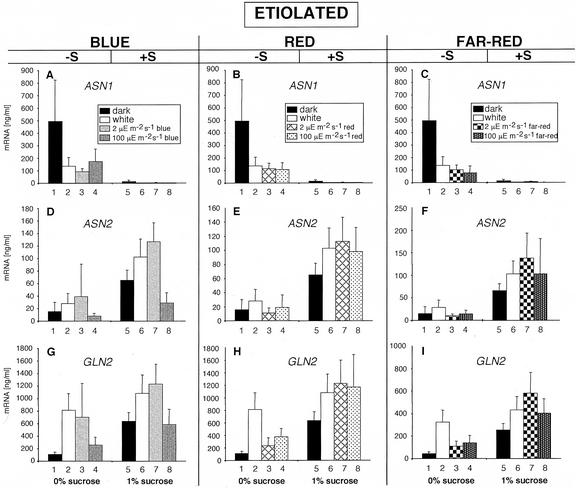
Figure 1.
Analysis of ASN1, ASN2, and GLN2 transcript accumulation in etiolated seedlings. A through C, ASN1 transcript levels in 7-d-dark-grown plants in the presence or absence of carbon and illuminated with WL, blue (A), red (B), or far-red (C) light. D through F, ASN2 transcript levels in 7-d-dark-grown plants in the presence or absence of carbon and illuminated with WL, blue (D), red (E), or far-red (F) light. G through I, GLN2 transcript levels in 7-d-dark-grown plants in the presence or absence of carbon and illuminated with WL, blue (G), red (H), or far-red (I) light. The carbon source used was 1% (w/v) Suc. All transcripts were measured using real-time quantitative PCR and normalized to a putative clathrin coat-assembly protein (At4g24550). The data represent the mean and sd of at least five separate experiments.

